April 17, 2020
Neighborhood sales, price points, current environment, number of days on market and available inventory, to name a few, determine if it is a buyers or sellers market. All of these factors can vary from each San Diego zip code. In this blog post, we take an in-depth view of the most recent real estate activity data in Metro San Diego neighborhoods and answer some of your most pressing questions about the current real estate environment. Discover what’s going in your neighborhood and see if now is a good time to buy or sell in San Diego.
Click here to view North County San Diego Real Estate Activity.
*All data courtesy of North San Diego County Association of REALTORS®, current as of April 4, 2020. All data from Shared Paragon Network. Report © 2020 ShowingTime. Reporting on Detached Single-Family Residential Activity and Attached Residential Activity Only.
Metro San Diego Overview
March 2020

*Metro San Diego Zip Codes: 92037, 92101, 92102, 92103, 92104, 92105, 92106, 92107, 92108, 92109, 92110, 92111, 92113, 92114, 92115, 92116, 92117,92118, 92119, 92120, 92121, 92122, 92123, 92124, 92126, 92131, 92139
Historical Median Sales Price
Metro San Diego
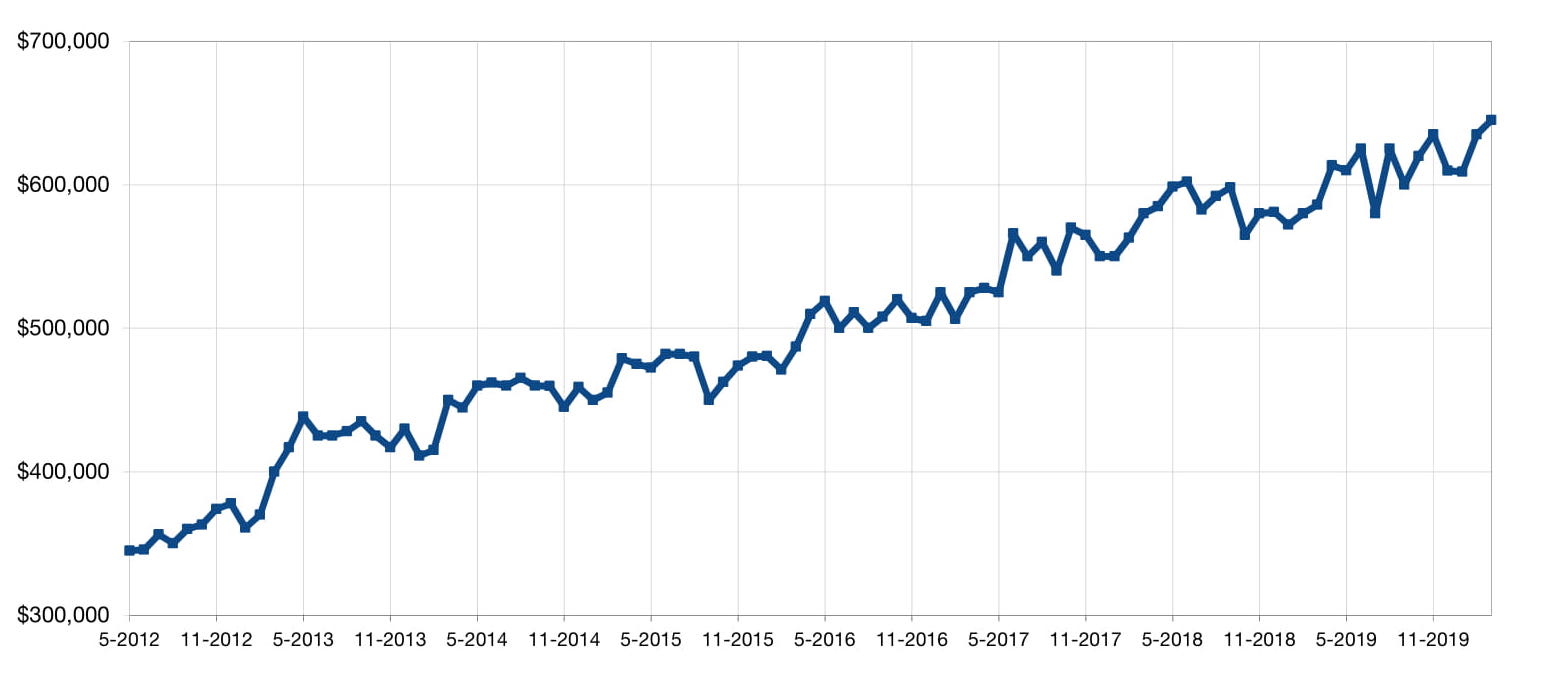
Metro San Diego San Diego
Homes for Sale and Homes Sold
March 2018-2020 Comparison

Metro San Diego Neighborhood Data March 2020
Each San Diego neighborhood is unique, below we've provided key metrics of real estate activity in Metro San Diego neighborhoods by zip code.
All Data provided by the North San Diego County Association of REALTORS®
Except where noted reporting on Detached Single-Family Residential Activity Only.
92117 - Clairemont Mesa Real Estate Market Activity, March 2020
Key Takeaway:
Low inventory.
Prices are up and selling close to list price.
Properties are staying on the market longer.
Sellers Market


92120 - Del Cerro Real Estate Market Activity, March 2020
Key Takeaway:
Increase in new listings and pending sales.
Decrease in closed sales.
Increase in price.
Selling at over 100% of list price.
Low inventory.
Sellers Market

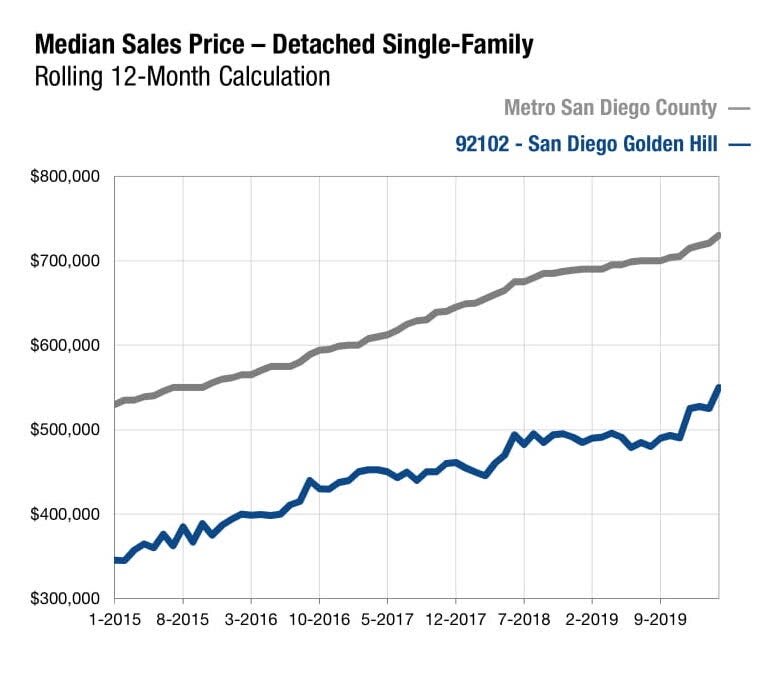
92118 - Coronado Real Estate Market Activity, March 2020
Key Takeaway
Increase in number of homes sold.
Home prices have decreased.
Number of days on the market has decreased.
Neutral/Buyers Market

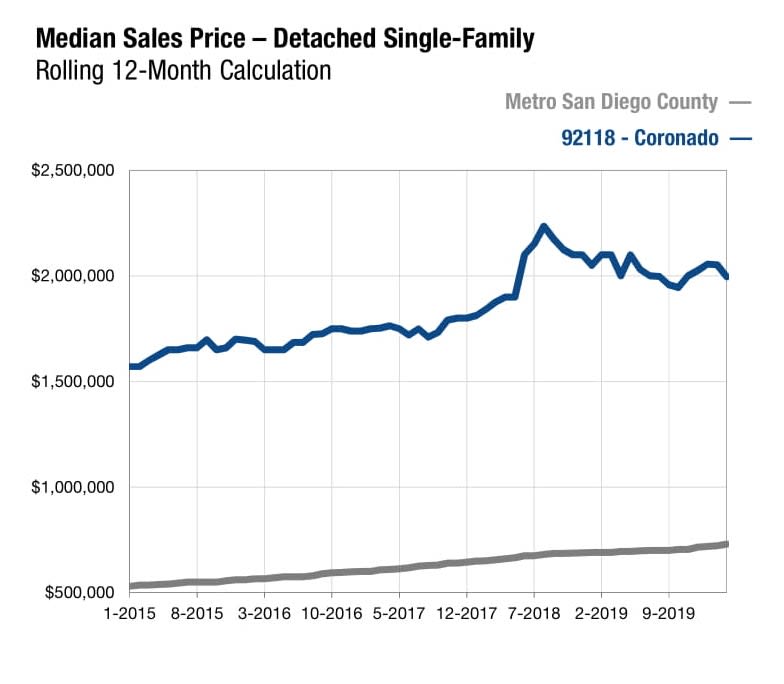
92101 - Downtown San Diego Real Estate Market Activity, March 2020
Reporting on Attached Single-Family Residential Activity Only.
Key Takeaway
Decrease in new listings.
Increase in closed sales.
Slight increase in price.
Properties staying on the market longer.
Month supply of inventory is higher than any other Metro San Diego zip code.
Buyers Market

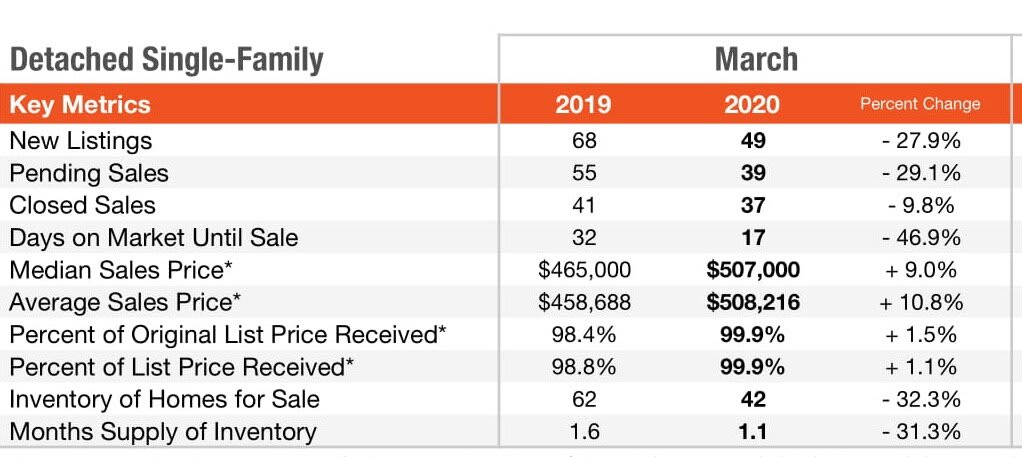
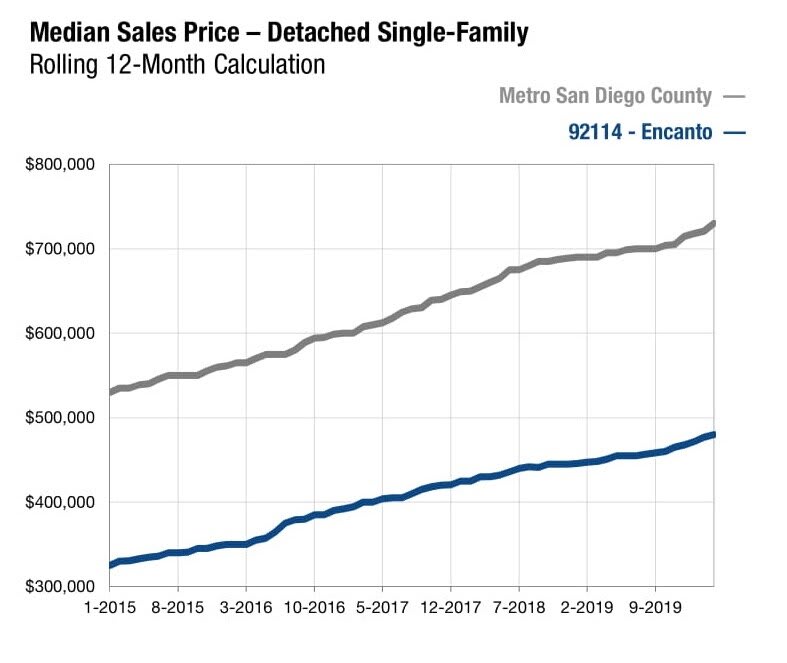
92114 - Encanto Real Estate Market Activity, March 2020
Key Takeaways
Low inventory.
Increase in sales price.
Selling fast.
Sellers Market
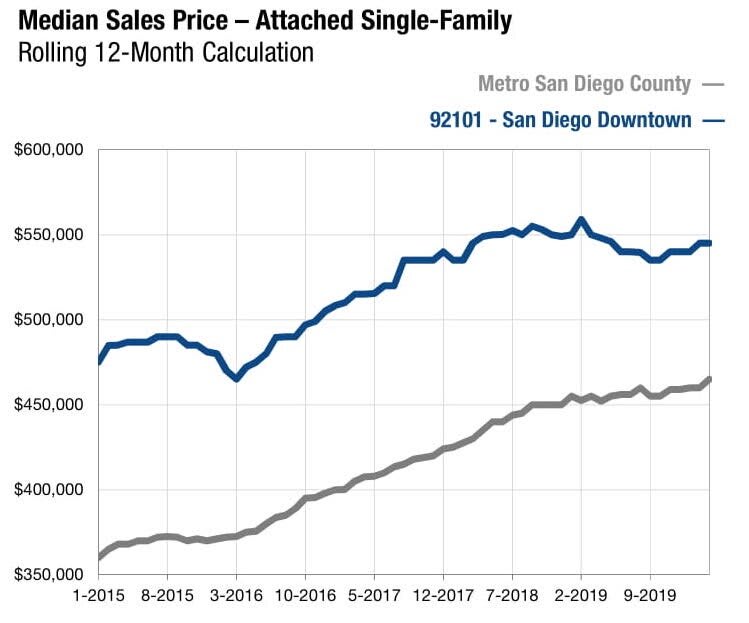
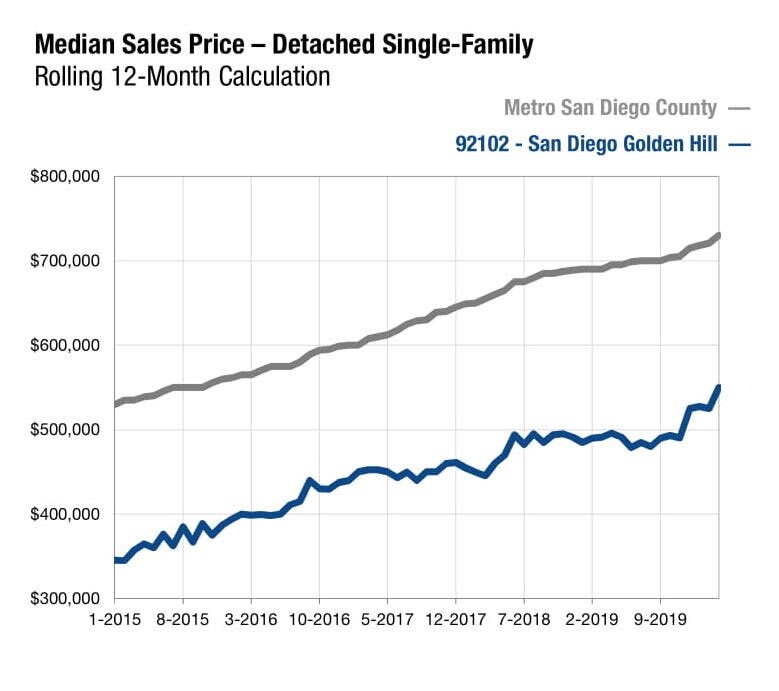
92102 - Golden Hill San Diego Real Estate Market Activity, March 2020
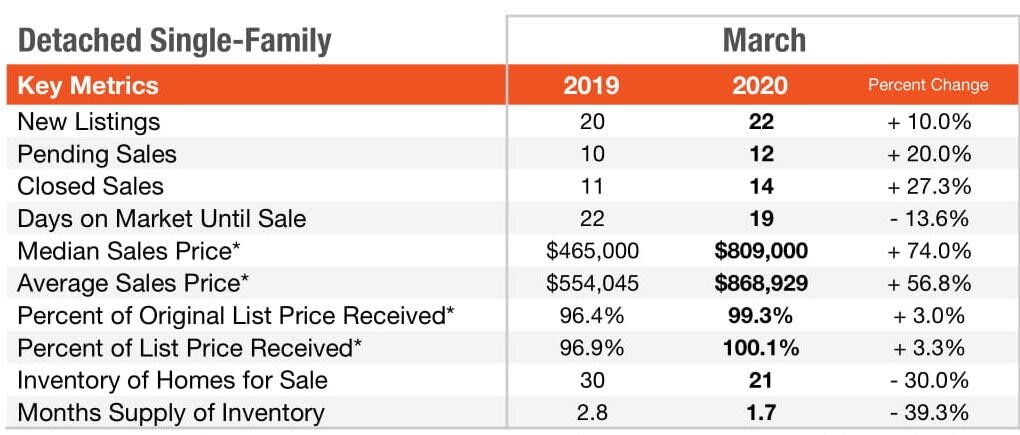
Key Takeaway
Increase in new listings.
Increase in pending and closed sales.
Significant increase in price.
Secrease in number of days on market.
Sellers Market
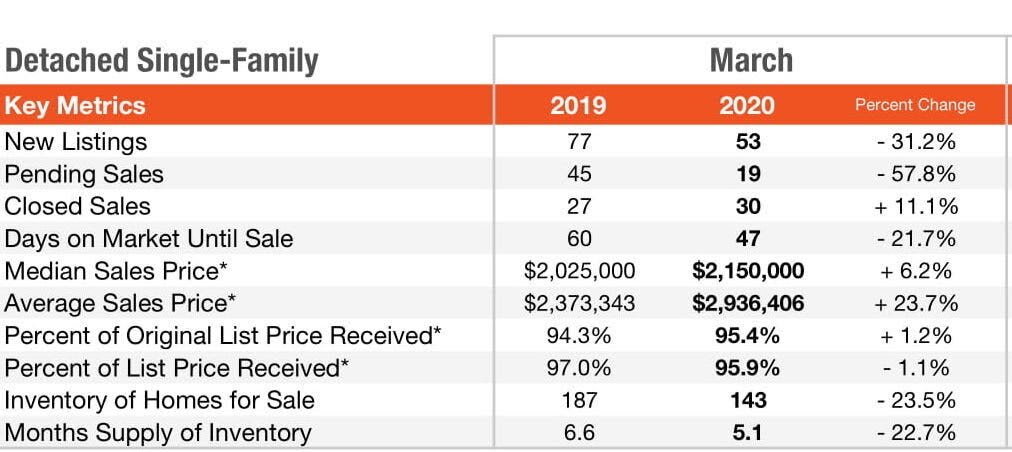
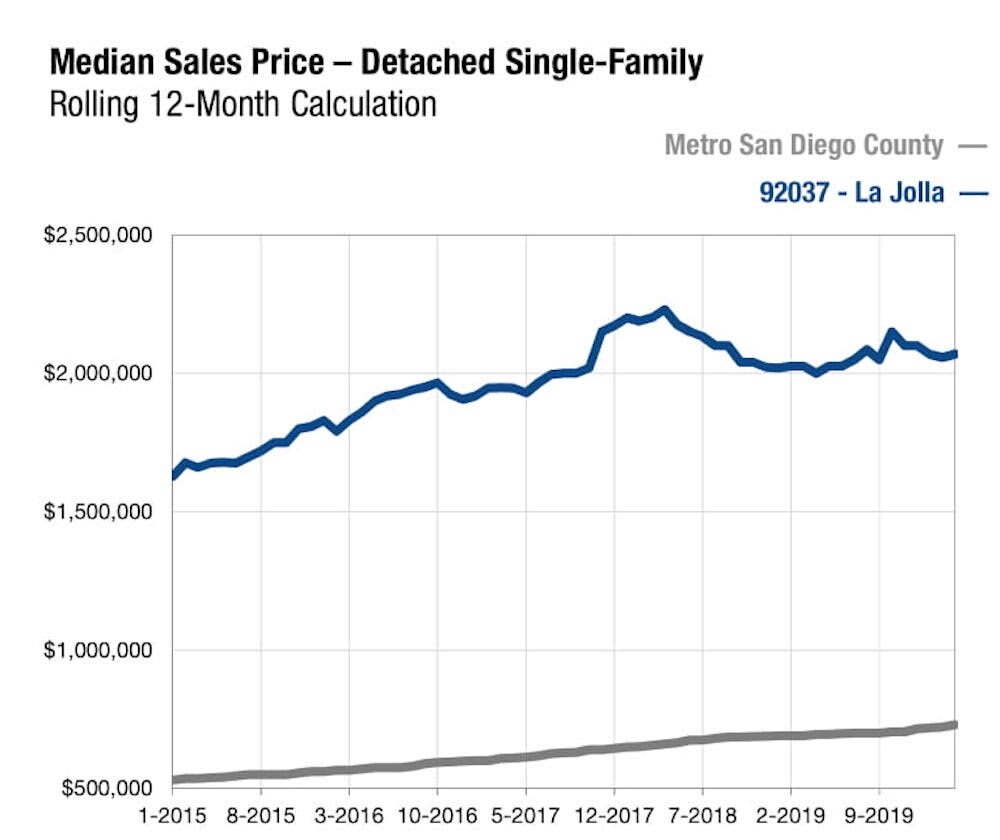
92037 - La Jolla Real Estate Market Activity, March 2020
Key Takeaway
Increase in closed sales.
Increase in price.
Decreased days on the market.
5.1 month supply of inventory.
Sellers/Neutral Market
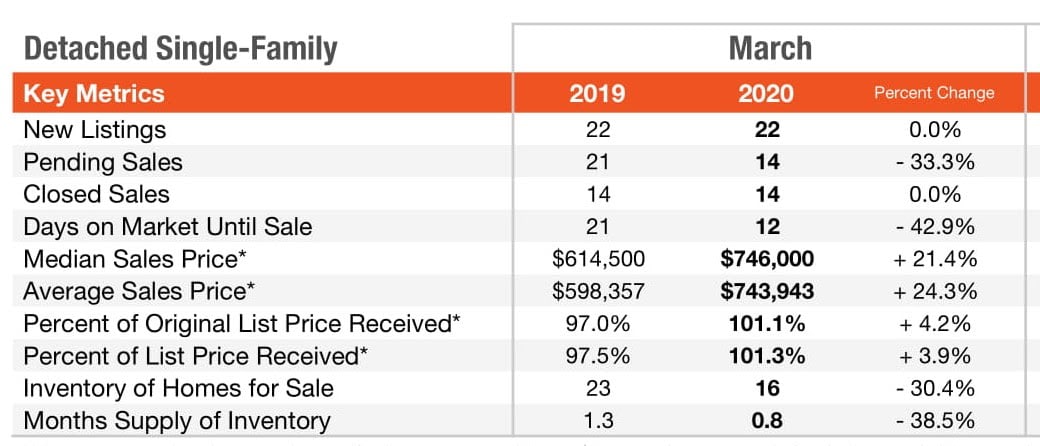
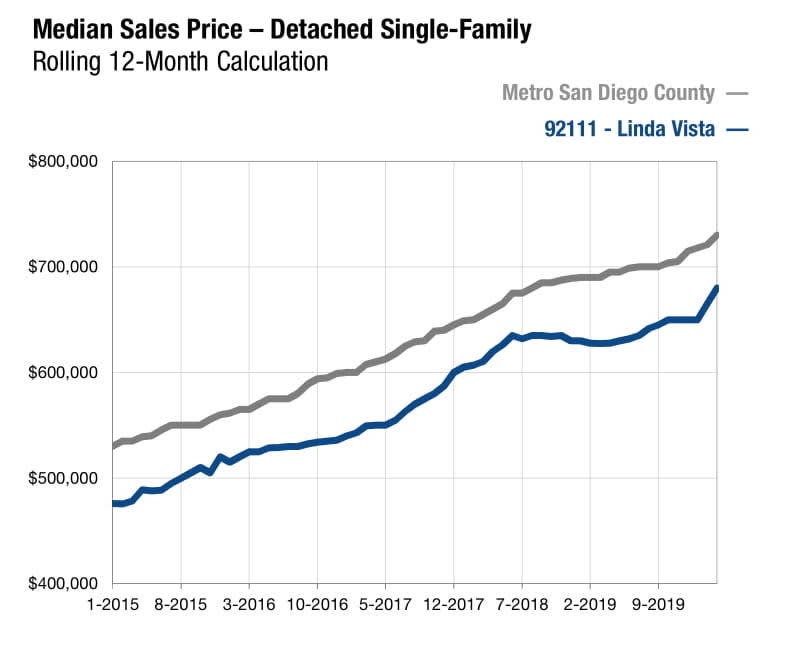
92111 - Linda Vista Real Estate Market Activity, March 2020
Key Takeaway
New listings and closed sales remain the same as March 2019.
Days on market decreased.
Sales price up with over 100% of list price received.
Low inventory.
Sellers Market
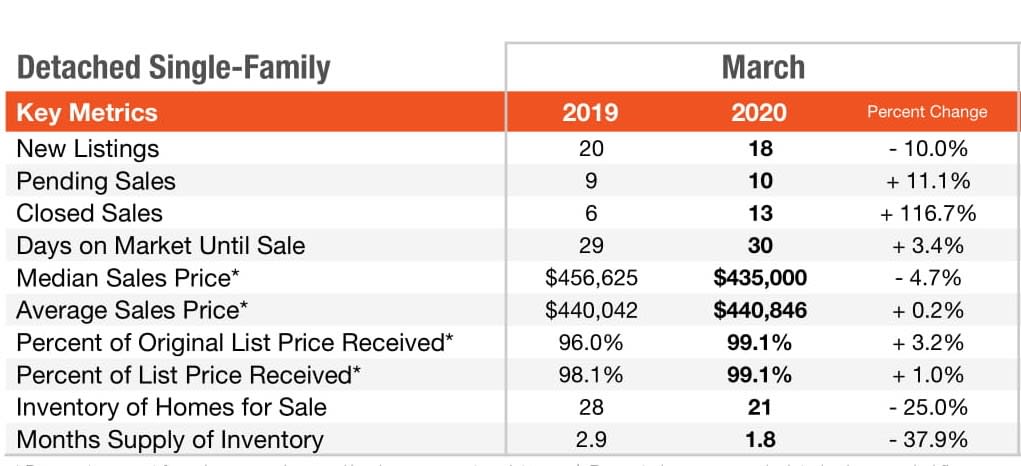
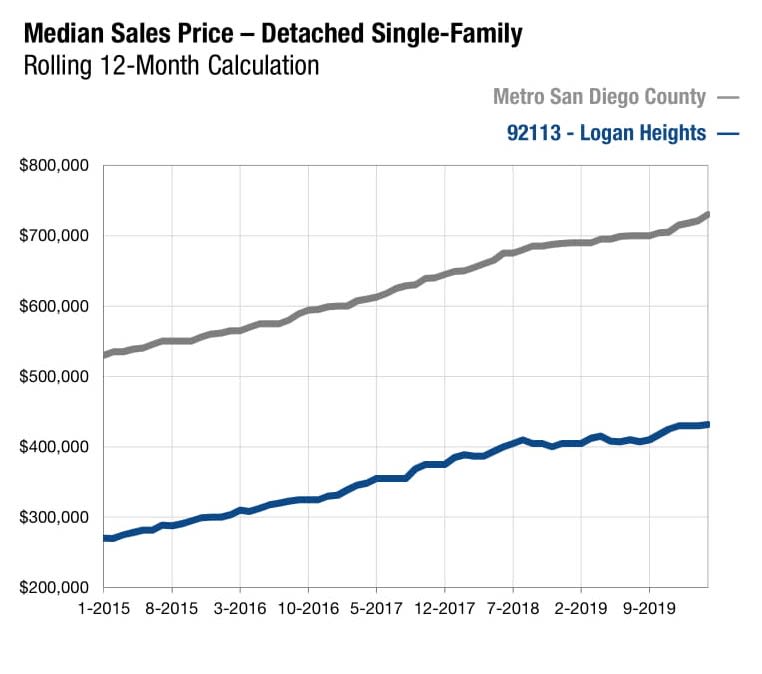
92113 - Logan Heights Real Estate Market Activity, March 2020
Key Takeaway
Pending sales and closed sales increased.
Average sales price increased while median sales price decreased.
Decrease in month supply of inventory.
Neutral Market
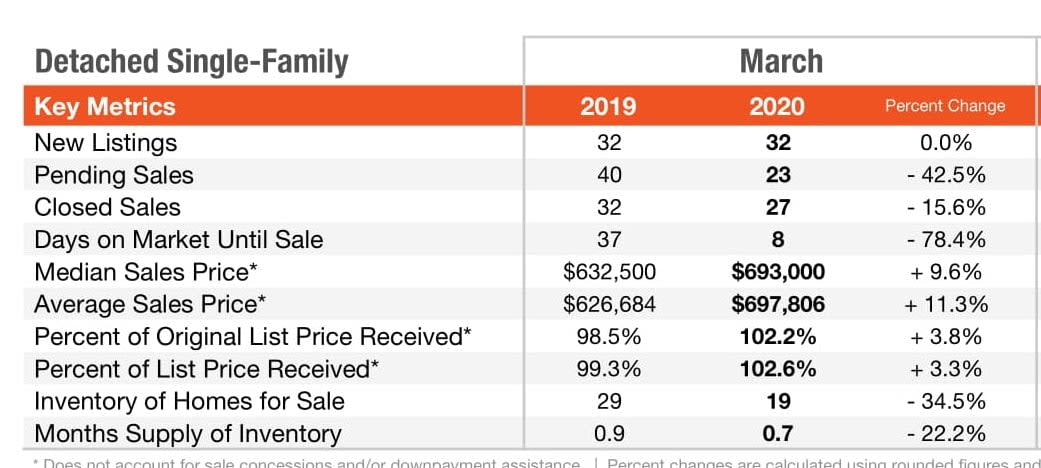
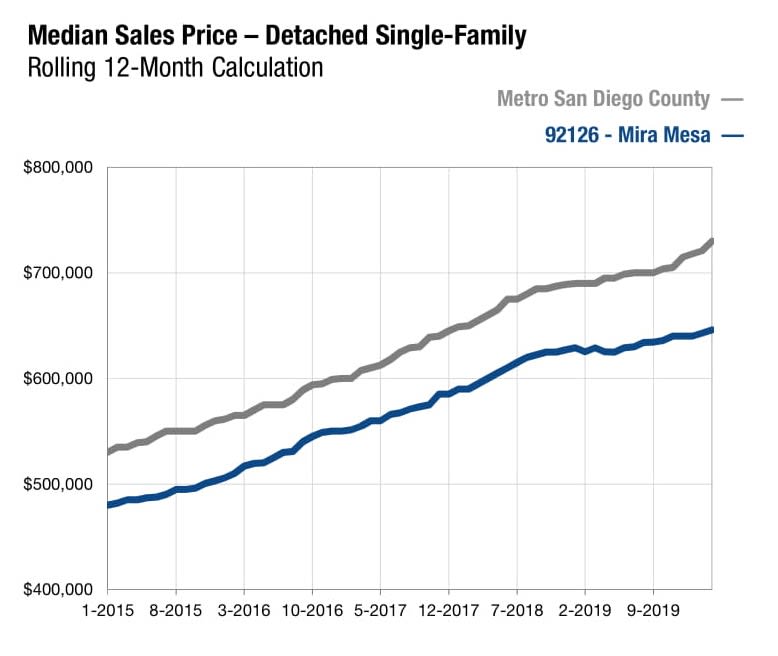
92126 - Mira Mesa Real Estate Market Activity, March 2020
Key Takeaway
Decrease in pending and closed sales.
Increase in price.
Selling at over 100% of list price.
Low inventory.
Sellers Market
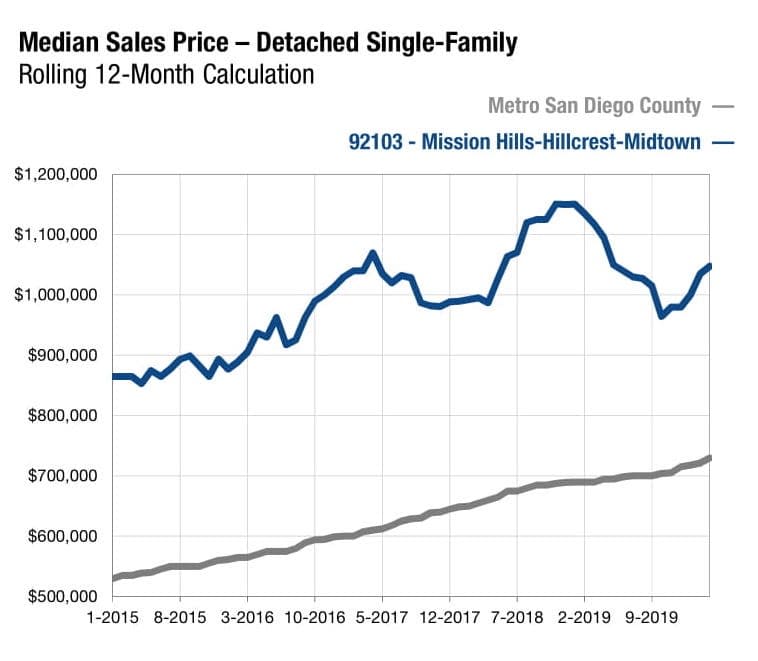
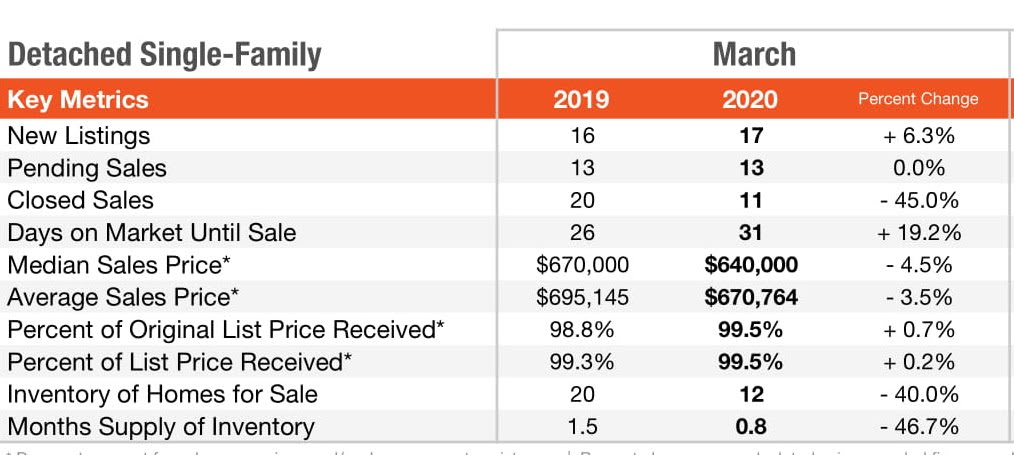
92103 - Mission Hills-Hillcrest-Midtown Real Estate Market Activity, March 2020
Key Takeaway
Low inventory.
Slight decrease in pending and closed sales.
Less days on market.
Increase in price.
Sellers Market

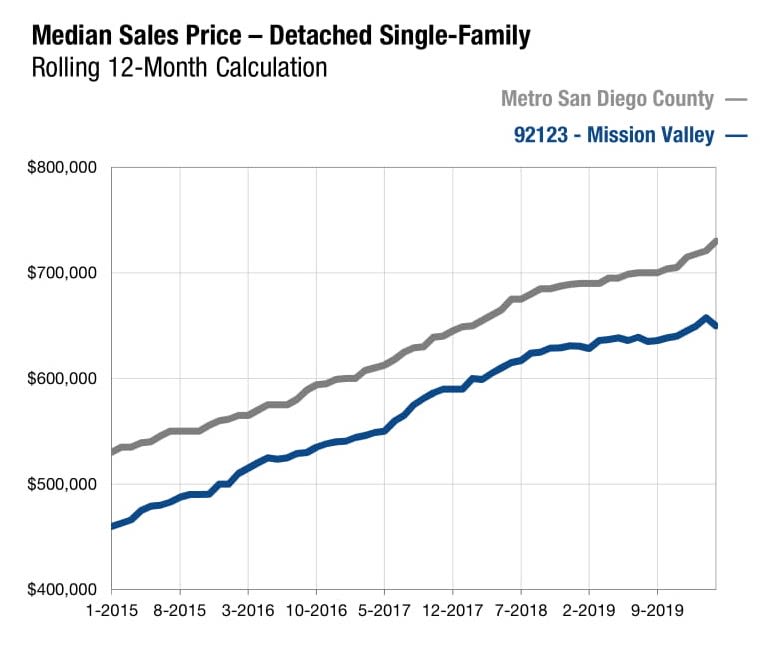
92123 - Mission Valley - Serra Mesa, Birdland, East Kearny Mesa Real Estate Market Activity, March 2020
Key Takeaways
Increase in new listings and pending sales.
Decrease in sales price.
Increase in days on market.
Low inventory.
Buyers/Neutral Market
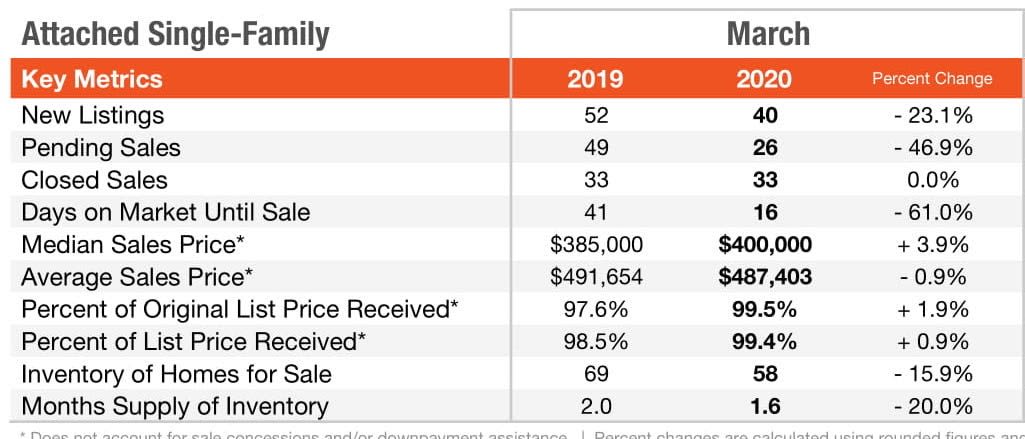
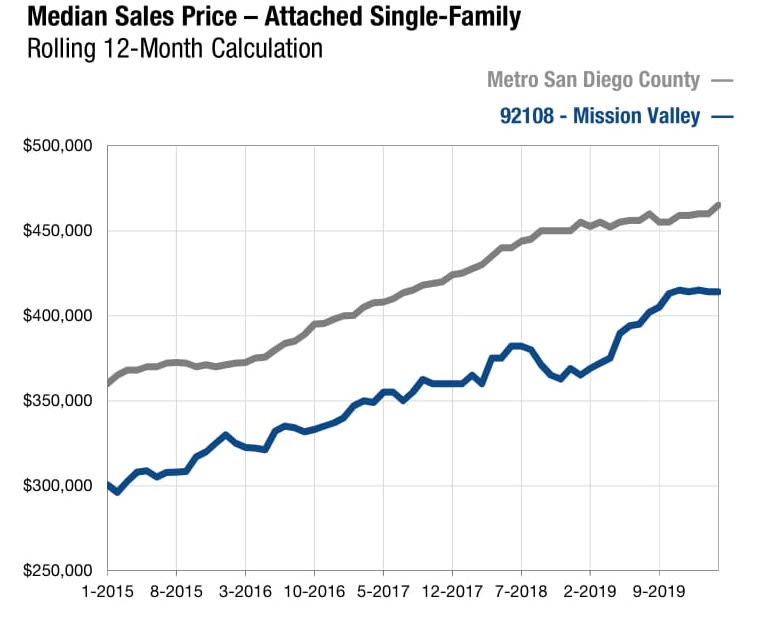
92108 - Mission Valley Real Estate Market Activity, March 2020
Reporting on Attached Single-Family Residential Activity Only.
Key Takeaway
Low inventory.
Decrease in pending sales.
Significant decrease in days on market.
Increase in median sales price, slight decrease in average sales price.
Sellers/Neutral Market
92104 - North Park Real Estate Market Activity, March 2020
Key Takeaway
Pending sales stayed decreased.
Increase in sales price.
Selling at over 100% of list price.
Days on market decreased.
Low inventory.
Sellers Market


92116 - Normal Heights, Kensington, University Heights, Real Estate Market Activity, March 2020
Key Takeaway
Increase in sold price.
Selling at over 100% of list price.
Days on market increased.
Low inventory.
Sellers Market


92107 - Ocean Beach Real Estate Market Activity, March 2020
Key Takeaway
Increase in new listings.
Decrease in pending sales.
Increase in sold price.
50% increase in homes sold.
Significant decrease in number of days on the market.
Selling at over 100% of list price.
Sellers Market


92110 - Old Town Real Estate Market Activity, March 2020
Key Takeaway
Decrease in new listings and pending sales.
Increase in closed sales.
Average sales price down but median sales price is up.
Low inventory of homes.
Homes are selling fast.


92109 - Pacific Beach Real Estate Market Activity, March 2020
Key Takeaway
Decrease in pending sales and closed sales.
Low inventory.
Slight decrease in price although selling at 100% of list price.
Properties sell on average in 3 weeks.
Neutral Market


92139 - Paradise Hills Real Estate Market Activity, March 2020
Key Takeaway
Decrease in new listings.
Decrease in pending sales and closed sales.
Properties selling fast over 100% of list price.
Low inventory.
Sellers Market


92119 - San Carlos Real Estate Market Activity, March 2020
Key Takeaway
Decrease in pending sales.
Increase in closed sales.
Average 15 days on market.
Increase in sold price.
Low inventory.
Sellers Market


92115 - San Diego - Mid City, College Area, Rolando Real Estate Estate Market Activity, March 2020
Key Takeaway
Decrease in pending sales and closed sales.
Properties selling fast and for a higher price than last year.
Significantly low inventory.
Sellers Market


92105 - East San Diego, City Height South, Oak Park, Real Estate Market Activity, March 2020
Key Takeaway
Decrease in pending and closed sales.
Houses are selling fast, 8 days.
Increase in sold price.
Properties selling at over 100% of list price.
Low inventory.
Sellers market


92131 - Scripps Miramar Real Estate Market Activity, March 2020
Key Takeaway
Increase in closed sales.
Increase price.
Low inventory.
Sellers Market


92121 - Sorrento Valley Real Estate Market Activity, March 2020
Key Takeaway
Low inventory.
Decrease in price however selling for over list price.
Short time on market, 9 days.
Sellers Market


92124 - Tierrasanta Real Estate Market Activity, March 2020
Key Takeaway
Increase in new listings and pending sales.
Decrease in median sales price.
Homes selling fast.
Low inventory.
Sellers Market


92122 - University City Real Estate Market Activity, March 2020
Key Takeaway
Increase in closed sales.
Increase in price.
Low inventory.
Sellers Market


Metro San Diego Real Estate Market Summary
All Zip Codes
- 1,575 homes listed for sale in Metro San Diego in March 2020, down 23.5% from last year
- 828 homes sold in March 2020, down 4.7% from last year.
- Days on Market Until Sale decreased 29.4%, 24 day average
- Median and Average Sales Price was up 10.1% & 14.9% in comparison to March 2019
What Does This Mean?
Properties are still selling in San Diego although the number of pending sales and newly listed properties decreased likely due to the current stay-at-home order. Properties that are on the market are selling faster than last year and at a higher price. This indicates that buyer demand is still high in San Diego especially for properties under $1 million.

So Who’s Making a Move Right Now?
Buyers taking advantage of the historically low interest rates.
Stock market investors looking for a more stable investment.
Job move or job loss.
Baby Boomers looking to downsize to a smaller space.
Generation X looking for a larger home to accommodate additional family members.
How Are Houses Being Shown?

Realtors® are rapidly adapting by utilizing a “touchless” home selling and buying approach. Read our blog post on Today’s 5 Home Selling Tools for more information.
Bottom Line
In all Metro San Diego markets, the number of homes listed for sales has decreased, sales prices have increased in 21 out of 26 Metro San Diego markets and the percentage of list price received is up in March 2020 compared to March 2019. The number of homes sold in Metro San Diego decreased in March likely due to the current pandemic and less inventory entering the market but homes are continuing to sell fast. Low Months Supply of Inventory in the majority of Metro San Diego zip code indicates San Diego still remains a competitive market.
So Is It a Good Time to Sell Your San Diego Home?
Yes, it is a great time to sell your home. Buyers are wanting to capitalize on the low mortgage rates and stock market investors are looking for safer places to invest. The price point of your property and location determines the size of the current buyer pool. Although we don’t know what the economy will look like three months from now or a year, if you delay putting your home on the market, you may run the risk of not getting the asking price you would like.
Curious to see what is on the market? Search homes for sale here.

If you would like more information about buying or selling a property in San Diego. Please contact us for a no-obligation discussion.
Sue De Legge & Gina De Legge-Habchi
DRE # 01304408 & DRE #01746528
Stay up to date with the San Diego real estate market, home selling and buying tips and local news and events, click here to join our newsletter.